Downtown Portland Clean & Safe monitors and publishes monthly foot traffic reports for the Clean & Safe District, offering a deeper look twice a year into downtown trends. These detailed reports highlight key intersections and uncover emerging patterns shaping the future of downtown.
 (click to download full map)
Six Months of Growth: A Downtown Milestone
The first half of 2025 shows stronger and more sustained momentum than 2024. For the first time in recent years, we’ve recorded six consecutive months of year-over-year growth (March–August). January led with a 22% increase over 2024, boosted by strong winter activations, followed by steady gains through the spring and summer.Key Highlights (January–August 2025)
- Six consecutive months of growth over 2024 (March–August), a milestone we did not see at all last year.
- January posted the largest gain (+22%), thanks to mild weather compared to 2024’s ice and snow.
- Saturdays remain the busiest day downtown, consistently outpacing other days of the week, with weekend activity driving retail and dining traffic. (Foot traffic on Saturdays is up 6.63% from 2024).
- Total foot traffic January–August 2025: 21.45 million (↑ 5.6% vs. 2024 for the same period).
Saturdays Still Rule Downtown
Saturdays continue to dominate as the busiest day in the Downtown Portland Clean & Safe District, closely followed by Fridays. Thursdays and Wednesdays also remain strong. This pattern shows the growing draw of weekend visitors alongside steady mid-week worker presence.Where People Gather: Our Busiest Corners
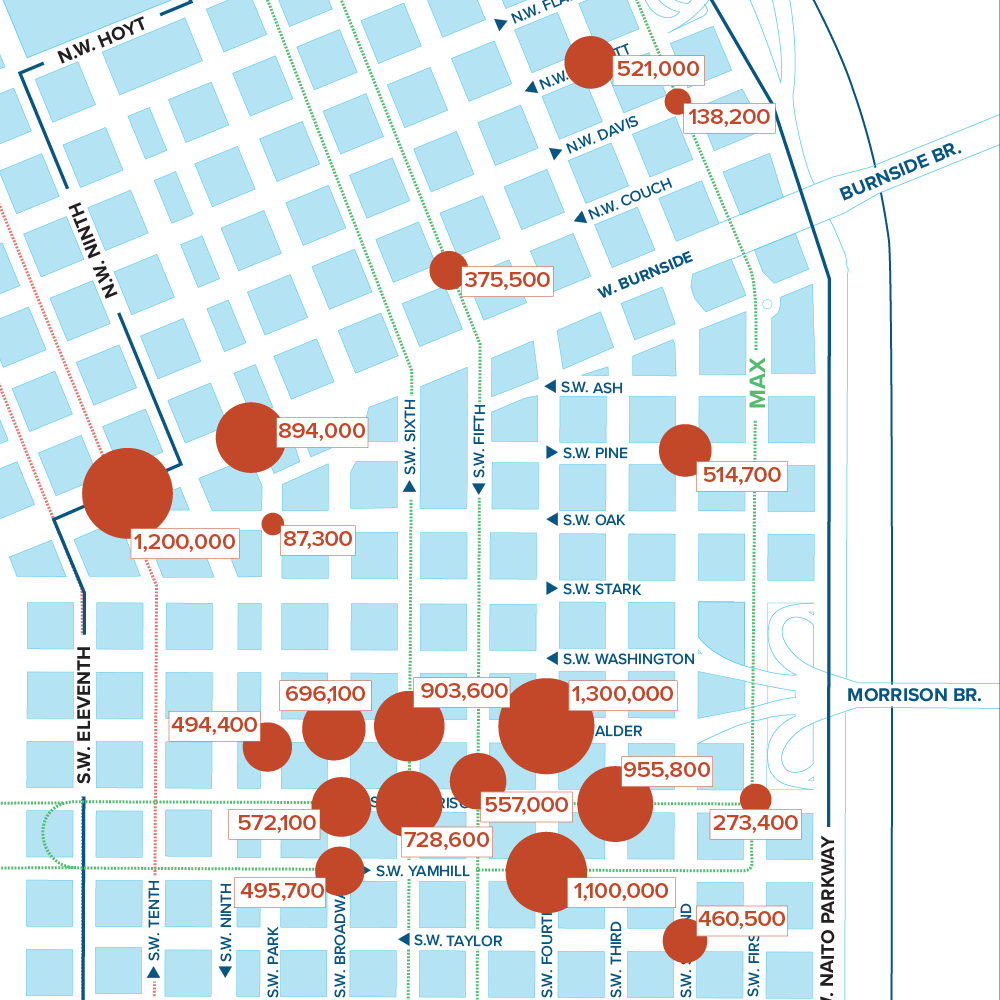
Downtown Portland Clean & Safe tracks pedestrian volumes at key intersections across our 213-block district. It’s important to note: these counts measure the number of times people pass a corner, not unique visitors. A single person walking through the same corner multiple times will be counted each time.Busiest Intersections (June 2025)
The data shows that Downtown’s core retail, cultural, and entertainment corridors remain the busiest — and many intersections are seeing strong year-over-year volumes.- SW 10th & Burnside (Powell’s Books / Pearl District / West End gateway) June 2025: 1.2 M crossings (steady compared to 2024)
- SW Park & Burnside (Cart Blocks food pod & North Park Blocks gateway) June 2025: 805 K crossings (down from 864K June 2024 but consistent with long-term averages)
- SW 4th & Yamhill (Pioneer Place retail hub) June 2025: 1.1 M crossings (30% increase over last year)
(click to download full map)
Old Town’s Growing Energy
Intersections Showing Notable Growth or Stability- 5th & Couch (Old Town Entertainment District) June 2025: 383 K crossings (+39% vs June 2024, signaling improved activity)
Key Takeaways
- High-traffic intersections are holding steady or growing, even compared to 2024’s period.
- Cultural and retail anchors continue to drive volume — Powell’s Books, Cart Blocks, Nordstrom, and Pioneer Place remain strong magnets.
- Old Town gateways are strengthening, with intersections like 5th & Couch showing sharp percentage gains.