Portlanders are increasingly choosing downtown to visit
Downtown Portland Clean & Safe has monitored and published monthly foot traffic data for the district for over a decade, offering a deeper look twice a year into downtown trends. These detailed reports highlight key intersections and uncover emerging patterns shaping the future of downtown.
Key Takeaways
- Downtown has seen five consecutive years of growth in January through August pedestrian activity.
- 2026 saw the busiest summer downtown since 2019, with pedestrian visits surpassing 3 million in July and August – the first months to reach this level since 2020.
- More than 22.2 million pedestrian visits were recorded through August – 3.6% higher than the same period in 2025.
- Foot traffic in August 2026 reached 81% of August 2019 levels, the strongest monthly recovery rate since 2020.
- Saturdays in 2026 are at a 92% recovery rate from 2019 and Sundays at a 91% recovery rate, with several weekend dates exceeding 2019 levels.
- In 2026, every month through August, visitor foot traffic totals surpassed 2025 levels.
Overall Year-over-Year Growth
Through August, Downtown recorded more than 22.2 million pedestrian visits, up 3.6% over the same period in 2025. Six of the first eight months of the year outperformed 2025, including a 7% year-over-year increase in July and a 6% increase in August. At the same time, total pedestrian activity remains at approximately a 77% recovery rate compared to 2019 levels.
The clearest remaining challenge is employee traffic. Adding the monthly counts from January through August, worker activity in 2026 is approximately 1% below 2025 and nearly 50% below the same period in 2019. Hybrid and remote work have fundamentally changed the traditional five-day office week, and Downtown continues to feel the effects, particularly businesses that have historically depended on a large, predictable weekday workforce. Coupled with the nation’s highest business and personal tax rates, employment traffic has not materially changed for several years – indicating structural policy barriers need to be addressed.
But that is only part of the story.
Visitor activity is moving in the opposite direction. Visitor counts increased year-over-year in every month from January through August, with particularly strong gains in February (+12%), July (+11%) and August (+7%). Collectively, visitor traffic through August is approximately 6% higher than 2025.
The weekend numbers make this shift even more visible. 16 Saturdays and Sundays in 2026 exceeded pedestrian traffic on the comparable weekend day in 2019, seven Saturdays and nine Sundays.
Across all comparable dates through August, Saturday foot traffic is now only about 8% below 2019, and Sunday traffic about 9% below 2019, compared with Fridays, which remain approximately 24% below 2019. Meanwhile, 80 of the 105 Fridays, Saturdays, and Sundays measured this year have outperformed 2025.
That difference points to something more significant than recovery: Downtown is increasingly becoming a place people choose to visit, rather than simply a place they are required to be for work.
Events and Festivals Drive Foot Traffic
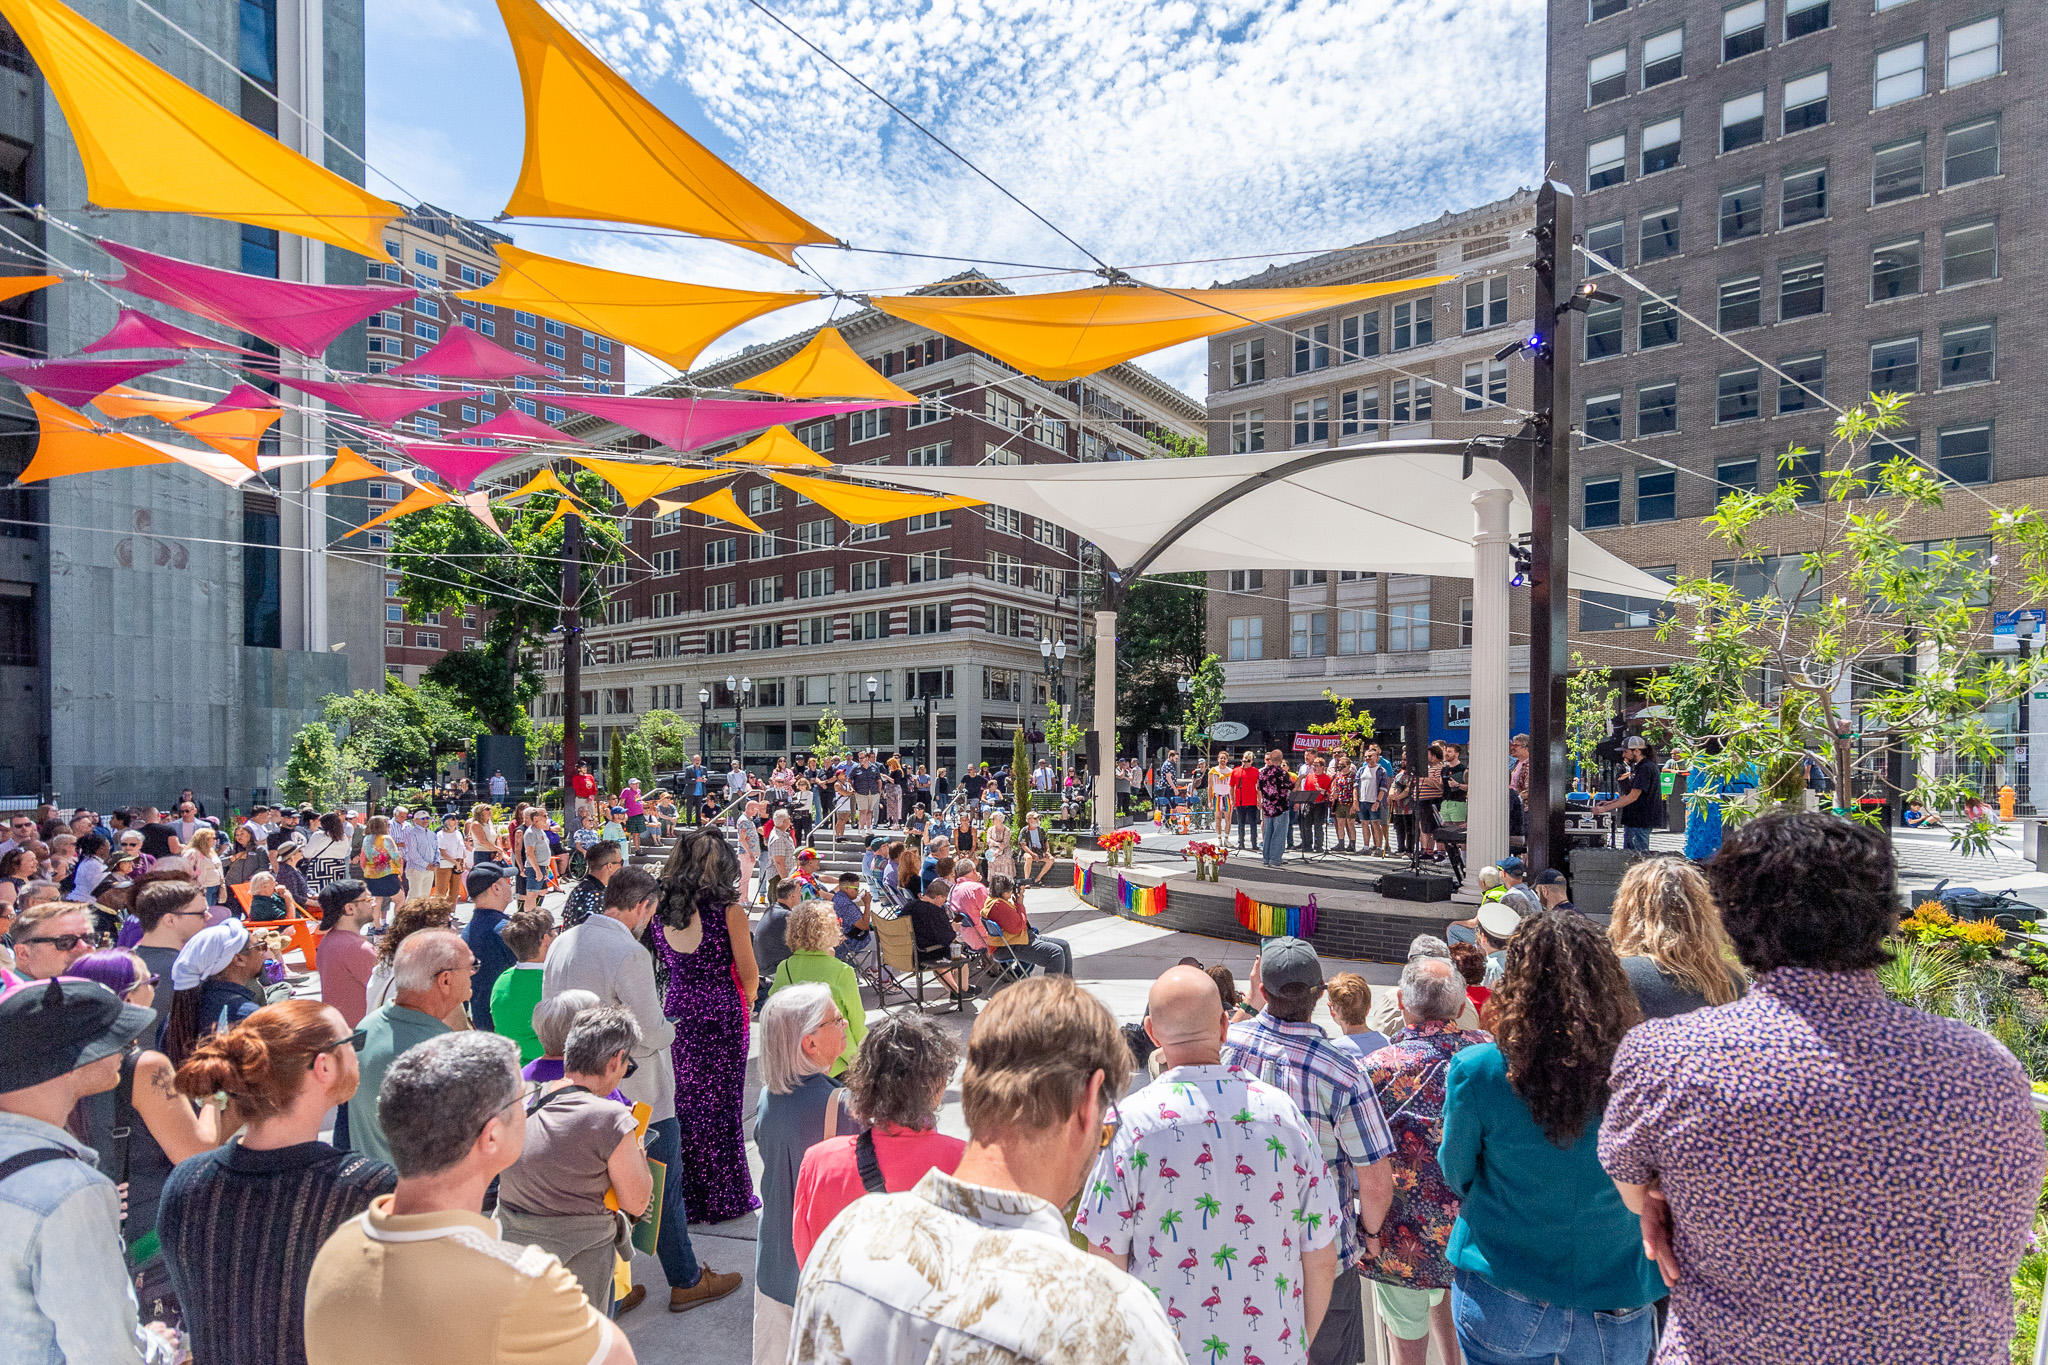
Many of 2026’s strongest weekends coincide with the experiences that give people a reason to make that choice: the Portland Winter Light Festival, peak cherry blossoms, NCAA March Madness, Portland Pride, Waterfront festivals, PDX Live concerts, the Rockstar Energy Open, Wildwood: Follow the Crows and other arts, cultural, sporting and community events.
On Saturday, August 15, for example, pedestrian traffic reached 123,548 – 35% higher than the comparable Saturday in 2019 – amid a particularly active Downtown weekend that included the Rockstar Energy Open at Waterfront Park, PDX Live at Pioneer Courthouse Square, and the Wildwood Follow the Crows art trail.
Where People Gather: Our Busiest Corners
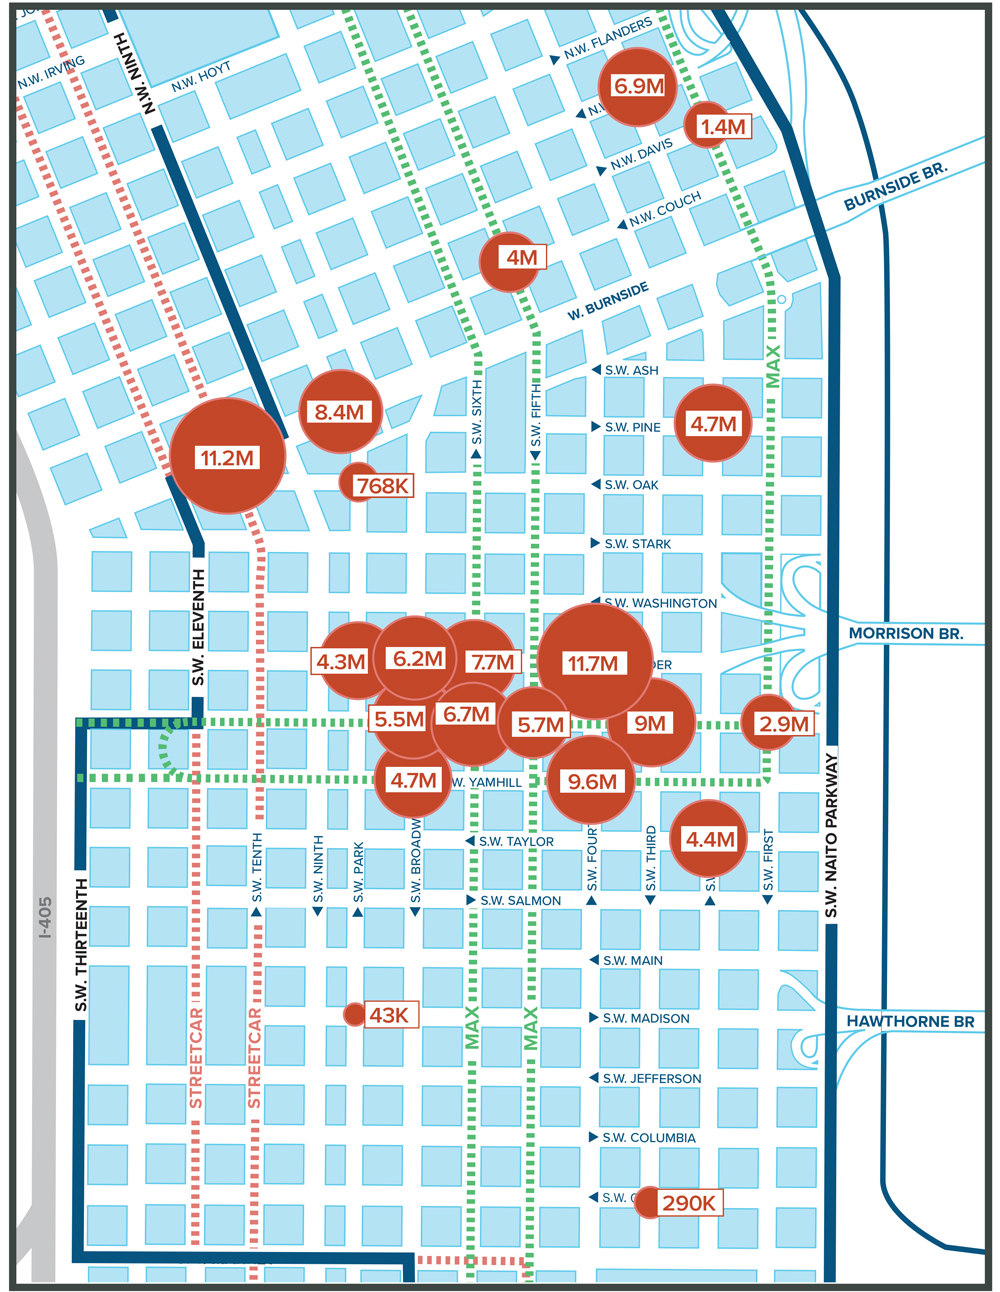
Downtown Portland Clean & Safe tracks pedestrian volumes at key intersections across our 273-block district. It’s important to note: these counts measure the number of times people pass a corner, not unique visitors. A single person walking through the same corner multiple times will be counted each time.
Busiest Intersections (June 2026)
The data shows that Downtown’s core retail, cultural, and entertainment corridors remain the busiest — and many intersections are seeing strong year-over-year volumes.
Conclusion & Looking Forward
Mirroring trends in 2025, gains in 2026 have been driven primarily by increased visitor activity, weekend engagement, and strong turnout during festivals, cultural gatherings, and holiday periods.
Office workers remain important to Downtown Portland – they are a critical base of support for local restaurants and businesses on weekdays and bring presence that supports safe, vibrant streets. Rebuilding the employment base must continue to be a priority and adding more housing and housing options should be viewed as an important part of Downtown’s long-term economic strategy.
The data increasingly suggests that Downtown’s future will be built by becoming a more complete neighborhood and a more compelling destination – a place to work, certainly, but also to live, dine, and gather.
Methodology
Using Placer.ai data to monitor traffic and visit trends 24-hours a day, Clean & Safe has expanded its pedestrian count research to look at the entire 273-block district. Downtown Portland Clean & Safe can now compare results from past years and even compare data to other cities, as well as look at times of day people are in downtown, which days are busier, and the spaces/venues people are frequenting. We closely track pedestrian activity within our 273-block district.
Our data provides insights into foot traffic trends, comparing year-over-year numbers. We monitor the overall number of visits to downtown, peak times of day, the busiest days of the week, and the spaces people are visiting most frequently. These figures represent cumulative totals rather than unique visitors, giving a comprehensive view of downtown vibrancy. Our foot traffic counts are sourced from Placer.ai. In April 2024, Placer updated its methodology to improve accuracy. This update slightly changes past figures compared to what we reported earlier. Moving forward, we’ll use the updated numbers for year-over-year comparisons to ensure consistency.