Key finding: Portlanders are choosing Downtown again, and Saturdays are telling the story
Downtown Portland’s pedestrian activity has entered a sustained recovery phase. While total foot traffic has not yet returned to pre-pandemic 2019 levels, the data shows consistent year-over-year growth, particularly on weekends and among visitors. Approximately 32 million pedestrians visited the Downtown Portland Clean and Safe District in 2025, up from 30 million in 2024—a 5.5% increase.
Saturdays reached 88.6% of 2019 volumes in 2025, with multiple individual Saturdays meeting or exceeding 2019 benchmarks. Major cultural events, festivals, and holiday periods are now reliably producing near-normal or above-normal activity.
See figure 1.
Overall recovery trajectory
Downtown pedestrian activity rebounded sharply from pandemic lows and has grown steadily since 2021. Total annual foot traffic increased each year from 2021 through 2025, driven primarily by gains in visitor and resident activity, while worker traffic has recovered more slowly. In 2025, overall volumes remain below 2019, but the gap has narrowed as discretionary trips continue to return. Notably, multiple Saturdays in 2025 exceeded 2019 levels.
The long-term pattern suggests Downtown is no longer in a volatile “reopening” phase but in a period of incremental normalization, where each year builds modestly on the last. This is important for business planning and public investment: the trend is consistently upward, not flat or declining.
The momentum is sustained: 18 out of the past 20 months saw year-over-year growth, and in 2025, 11 out of 12 months recorded higher foot traffic than the same months in 2024—a significant improvement from 2024’s seven consecutive months of growth. This pattern, driven primarily by visitors, weekend activity, and strong turnout during cultural events and holidays, underscores that Downtown’s recovery is durable, not episodic.
See figure 2.
Shifting composition: visitors lead the recovery
A key structural change in Downtown activity is who is returning:
- Visitor traffic has shown the strongest rebound and is now the dominant driver of growth. By 2025, visitor volumes substantially exceeded pandemic-era levels and are approaching pre-pandemic benchmarks.
- Resident activity has increased 17% from 2019 to 2025 (3,779,545 to 4,440,020), establishing a dependable baseline of daily use even during periods of lower tourism and commuting.
- Worker traffic, while improving each year since 2021, remains the slowest-recovering segment. Hybrid and remote work patterns continue to suppress weekday volumes relative to 2019.
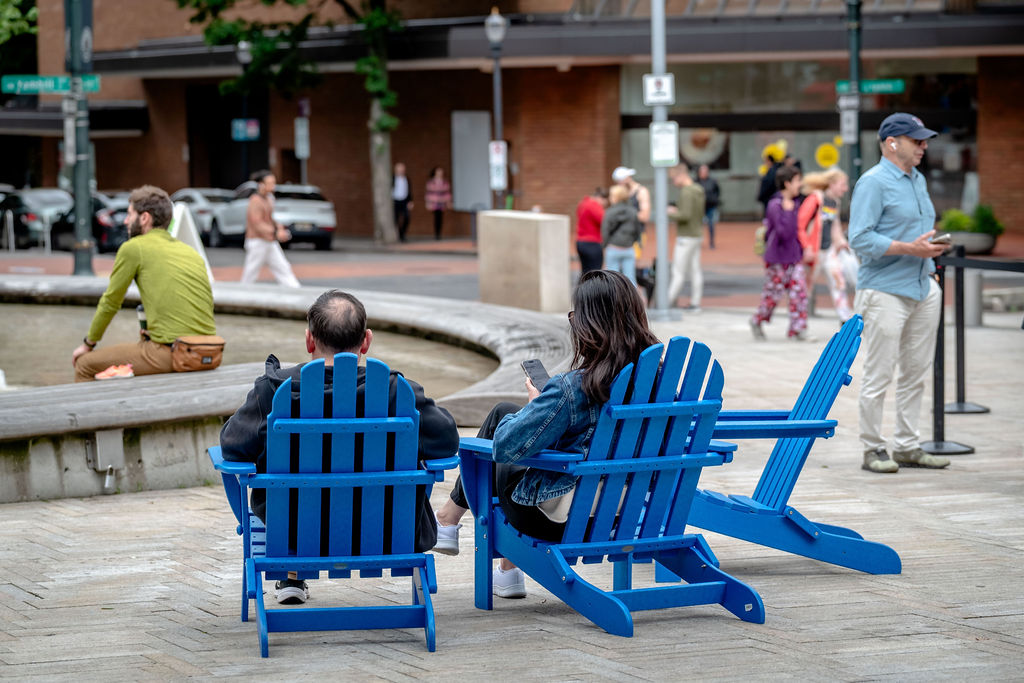
This composition matters. Downtown is no longer dependent on office commuters alone. Instead, it is increasingly supported by tourism, events, retail, dining, arts, and resident activity—a more diversified demand base that aligns with long-term placemaking and experience-driven economic strategies.
Another encouraging shift is the evolution of community gatherings and protests downtown. Unlike in 2020, these events have been largely peaceful and, rather than deterring activity, often draw people into the core, where many shop, dine, and support small businesses before and after the gatherings.
Weekday vs. weekend dynamics
The contrast between weekdays and weekends is one of the most important findings in the data. While weekday patterns continue to evolve, Saturdays in Downtown Portland have rebounded to nearly 90 percent of pre-pandemic levels, with many weekends matching or surpassing 2019 activity. This clearly shows that when people have a choice, they are coming back to shop, dine, gather, and experience the city.
Fridays and Saturdays now significantly outperform mid-week days in recovery terms. Saturdays, in particular, have emerged as the strongest indicator of Downtown’s resurgence:
- 2019 Saturday total: 6,528,120
- 2025 Saturday total: 5,783,911
- Recovery rate: 88.59%
See figure 3.
In 2025, seven Saturdays exceeded 2019 foot traffic, including February 8 (Lunar New Year and Portland Winter Light Festival), a Saturday during Cherry Blossom season, the Rockstar Energy Open/PDX Live Events weekend, a No Kings Rally Saturday, and—significantly for retail businesses—Small Business Saturday on Thanksgiving weekend. Monthly trends further reinforce the role of programming, tourism, and seasonality:
- Spring (March–May): Marked improvement tied to cherry blossom season, retail activations, and signature events.
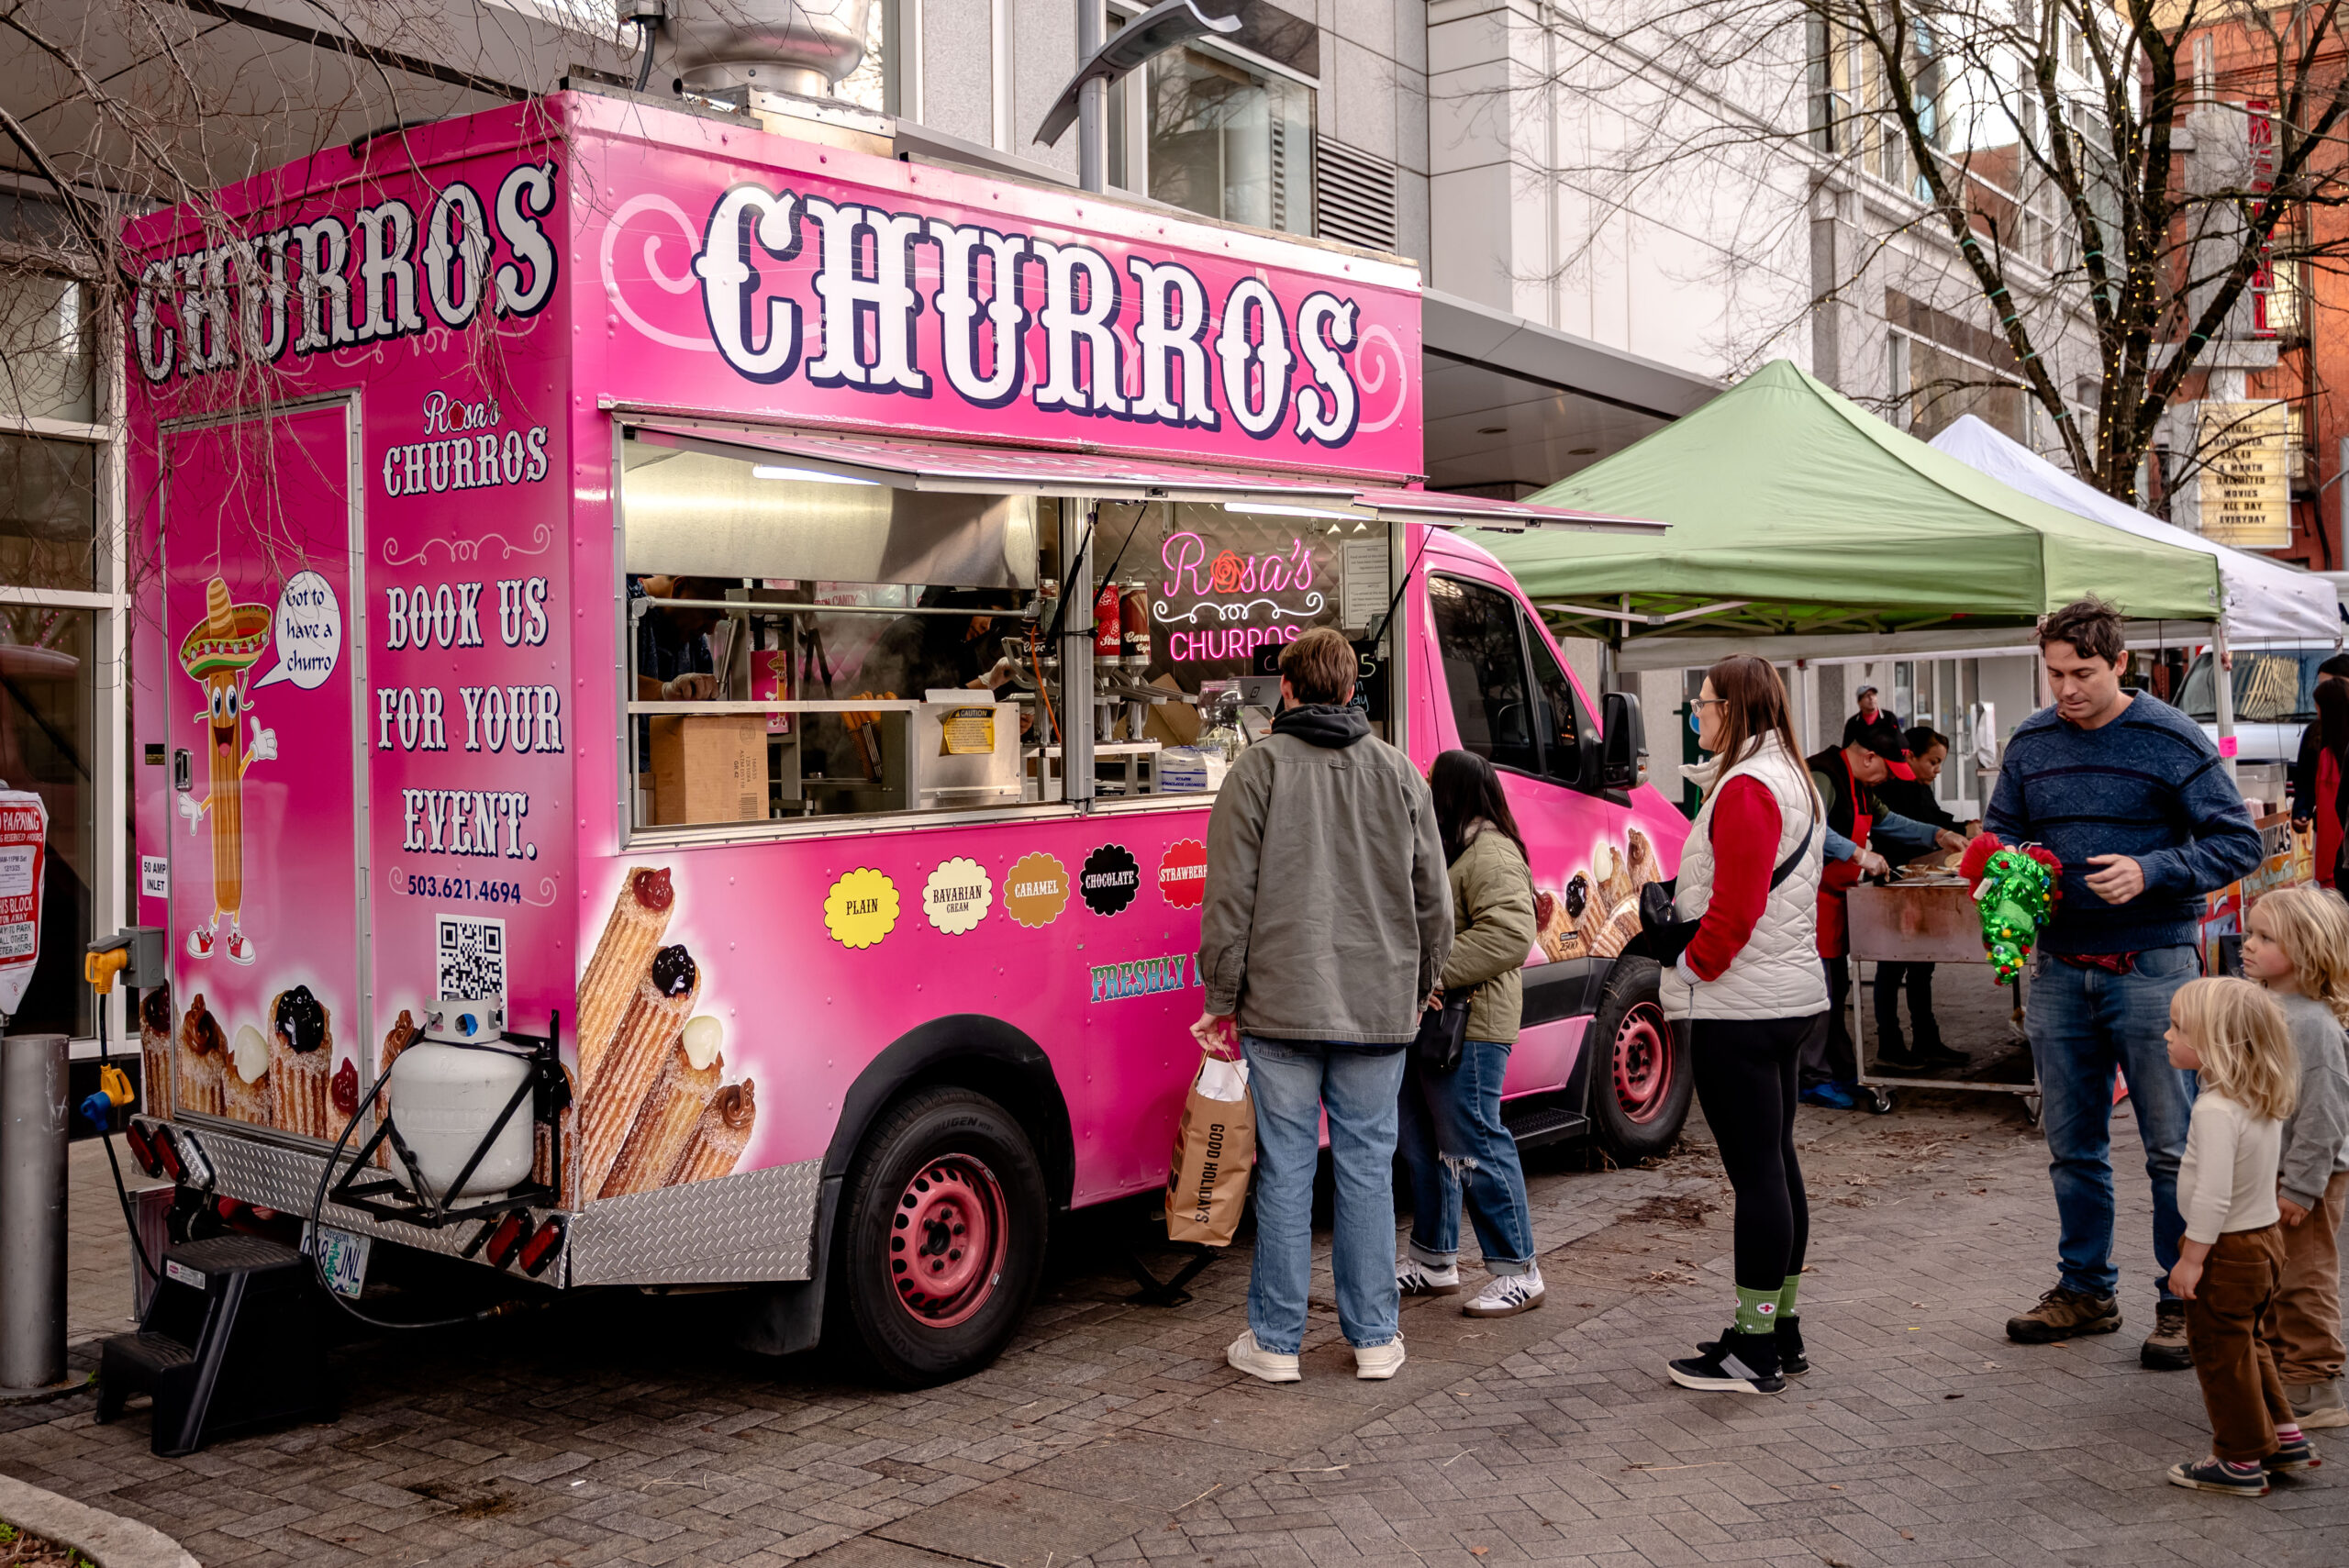
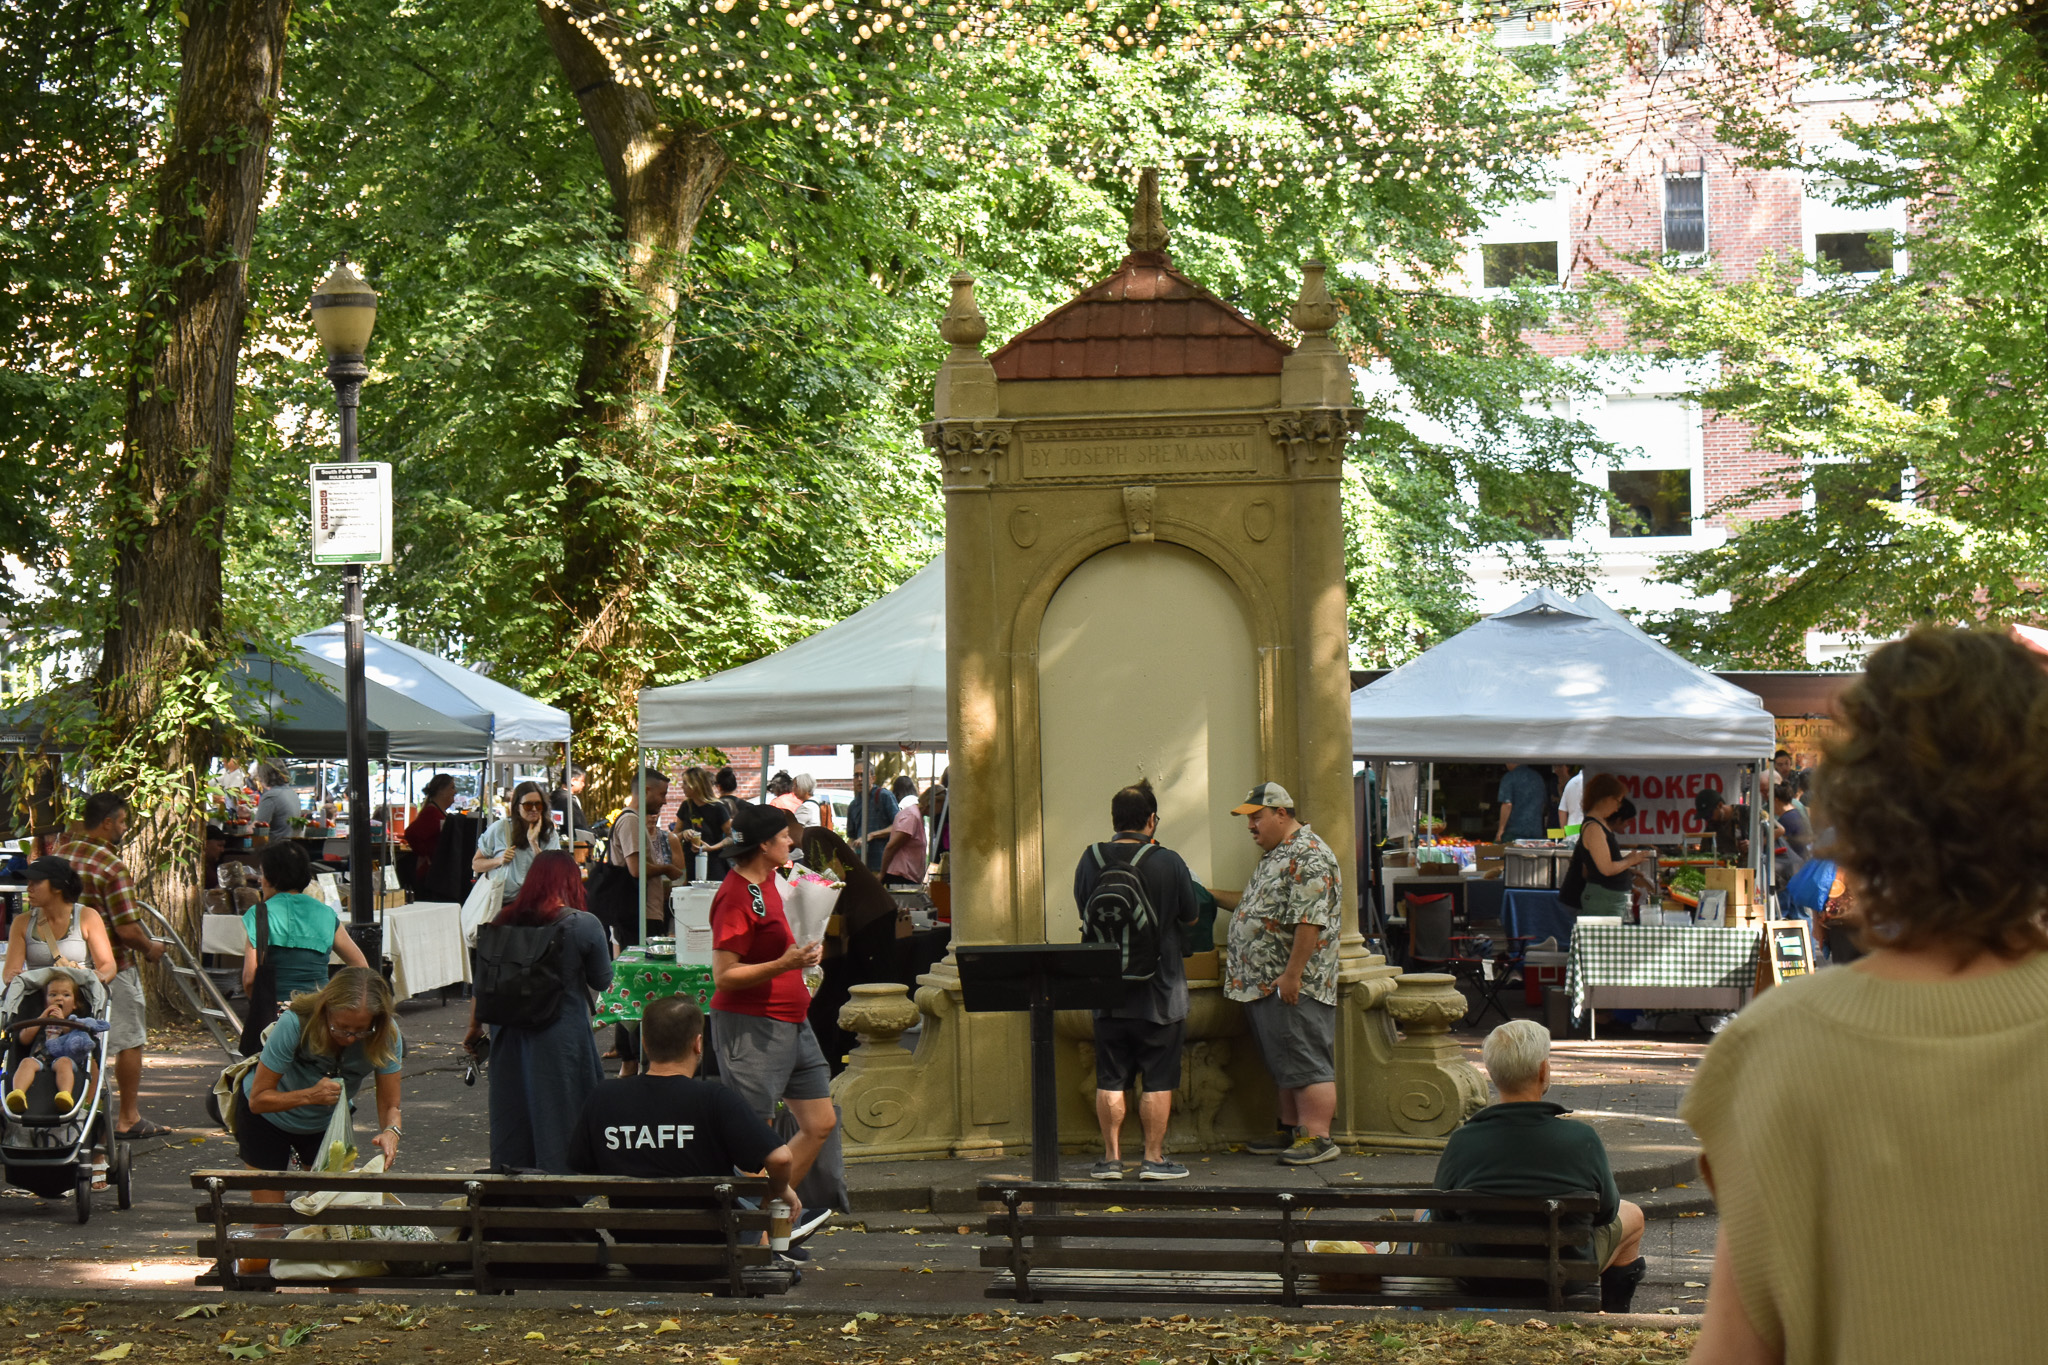
- Summer (June–August): Consistently among the strongest months, with major outdoor festivals, waterfront events including the Rose Festival and Blues Festival, and large-scale programming such as Punk in the Park, PDX Live, and the Rockstar Energy Open.
- Fall (September–October): Stable, with several high-performing Saturdays.
- Holiday season (November–December): Continued year-over-year growth. Notably, November 2025 recorded a 5.0% increase over November 2024, demonstrating that holiday retail and tourism activity continues to strengthen.
These discretionary weekend visits demonstrate that visitor confidence and downtown vibrancy have largely returned, with seasonal peaks tied to major cultural events, festivals, and holiday periods now reliably producing near-normal or above-normal activity.
Worker foot traffic has stalled
Weekday volumes, especially worker-driven trips, remain the primary drag on full recovery. Mondays through Wednesdays remain substantially below 2019 levels (see figure 3 above), reflecting the lasting impact of hybrid work and reduced commuting. Employers and employees are essential to the downtown core. Increasing foot traffic should be a key policy priority, with a focus on promoting employer and employee activity. Without sustained worker presence, Downtown will not achieve the vibrancy of a thriving central city. This divergence underscores a fundamental shift: Downtown is functioning more as a destination and experience center than as a five-day-a-week office district.
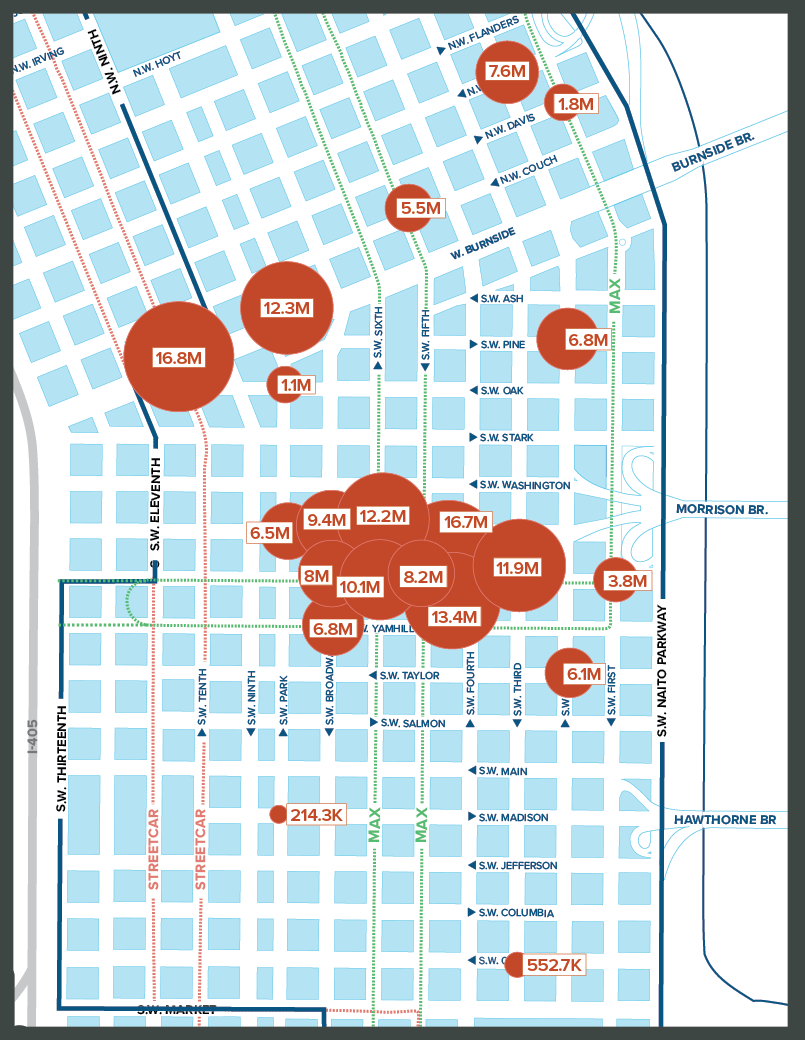
Intersection hot spots
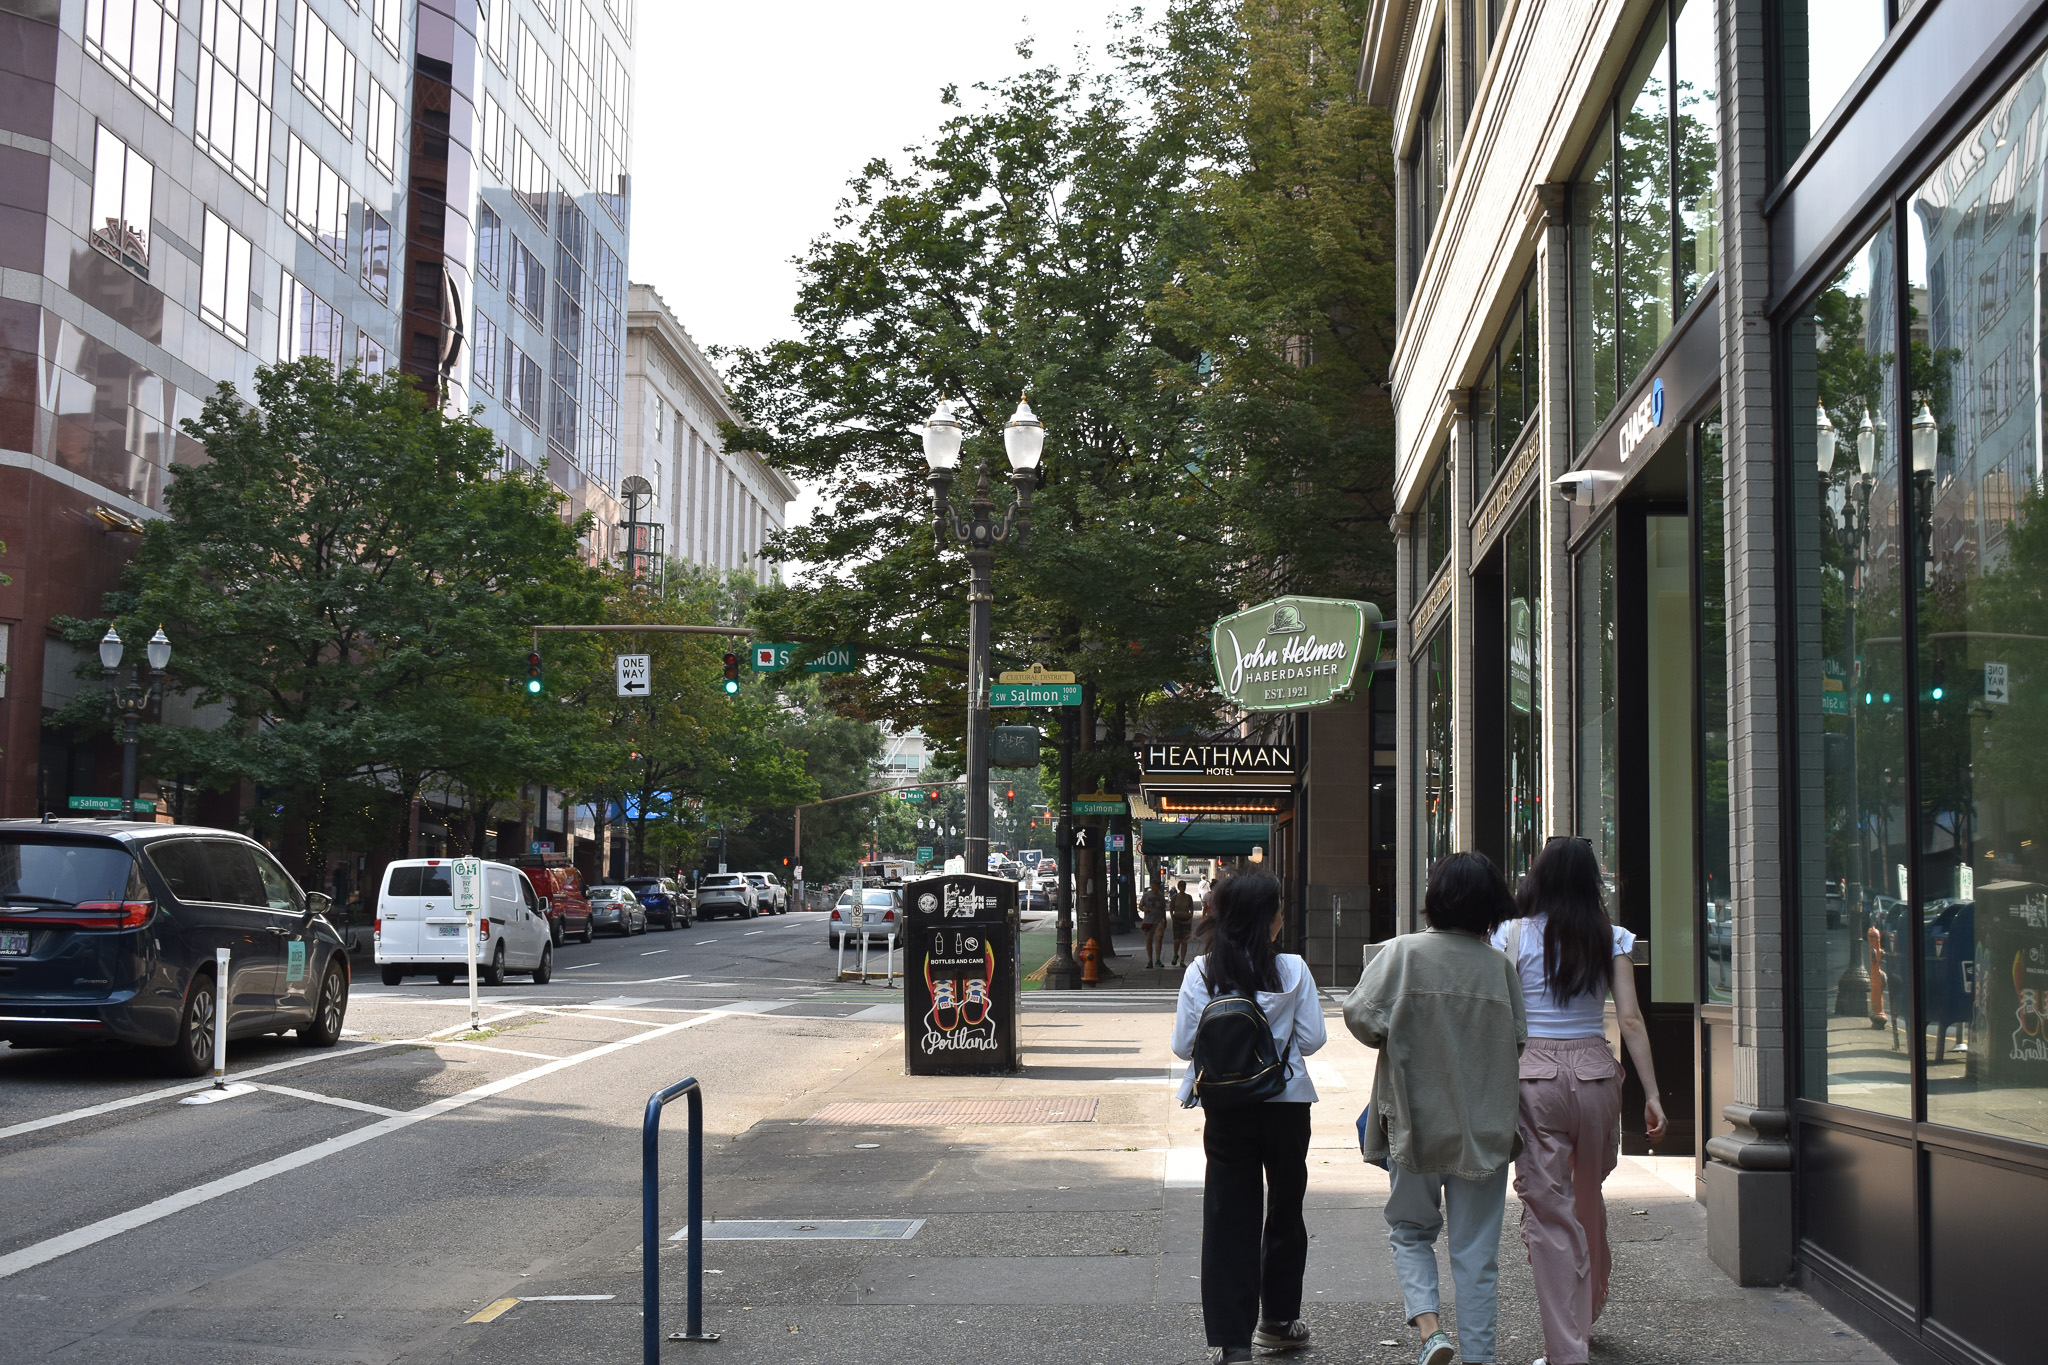
SW 10th Ave and Burnside remains the busiest intersection in the Downtown Portland Clean & Safe district, and this busy foot traffic area is a gateway to the West End Neighborhood, Downtown, and into the Pearl District. It is flanked by Powell’s, Shake Shack, Union Way, and indie stores like Wildfang and Tender Loving Empire.
We are seeing foot traffic particularly high in the Downtown core around Pioneer Place Mall, Pioneer Courthouse Square, and on Broadway near Nordstrom and Columbia Sportswear. These patterns are very reflective of pre-pandemic activity.
Conclusion: An increasingly vibrant Downtown still in recovery
Downtown Portland in 2025 is evolving into a more visitor-, resident-, and experience-driven district. Foot traffic continues to rise year over year, with Saturdays recovering to 88.6% of 2019 levels and multiple peak days exceeding pre-pandemic benchmarks. Seasonal surges tied to festivals, arts, retail, and tourism are now reliable, repeatable drivers of activity.
While weekday and worker recovery remains incomplete, the broader trend is clear: Downtown’s future is increasingly anchored in events, culture, tourism, and quality of place. The data demonstrates that when Downtown offers compelling reasons to visit—festivals, markets, arts, shopping, dining, and public-space activations—people show up.
This shift represents both a challenge and an opportunity. The challenge is to adapt infrastructure, retail mix, and policy to a less commuter-centric model. The opportunity is to build a Downtown that is more resilient, diversified, and aligned with how people now choose to live, work, and experience cities.
Long-term, we must address the fundamental barriers to worker foot traffic by supporting private-sector growth and business development in the core.
Methodology
NOTE: On October 1, Downtown Portland Clean & Safe expanded its district for the first time in our history. The newly added 60 blocks, primarily to the west and south, bring a somewhat different mix of activity. In particular, these areas reflect a higher proportion of resident traffic, which is now incorporated into our overall foot-traffic counts. For this analysis, we use Placer.ai data applied retroactively to the full, expanded district back to 2019.
Importantly, the trends captured here are consistent with those observed in the district prior to expansion.
See figure 4.
Downtown Portland Clean & Safe uses Placer.ai to monitor foot traffic and visit trends 24-hours a day and looks at the 273-block geographic boundary of the Clean & Safe district. Placer.ai data allows us to look at times of day people are downtown, which days are busier, and the spaces/venues people are frequenting. Individuals are counted each time they cross into our district or, when looking at particular intersections, each time they cross that intersection.
Placer.ai uses an algorithm to separate visitor counts, employee counts, and resident counts, which essentially examines patterns in length of stay. For example, users who spend approximately 8 hours a day in a specific location regularly are counted as employees. Users who spend their nights in one location regularly are counted as residents.