Twice each year, our teams count pedestrian traffic at key intersections during peak hours within the Downtown Portland Clean & Safe District, a 213-block enhanced services district in the heart of our city.
These counts are used to monitor change in walking patterns during the summer and winter months, year over year and better understand the flow of pedestrians through our city’s center.
The results of our latest pedestrian count conducted over three days, Dec. 10, 11, and 12, 2020, are below.
With COVID-19 public health closures still in effect for December, 2020, we expected to see a dramatic decrease than in years past. What we found is pedestrian traffic is 82% lower than this same time period last year, December 2019.
As a comparison, for every person walking downtown in December 2020, there were four more in 2019.
BLOCK BY BLOCK COMPARISON
For the past 15 years, the pedestrian counts are carefully conducted during the months of June and December and recorded by the teams at Downtown Portland Clean & Safe (read past reports here). The locations of each intersection included in the count change year to year for several reasons, some of which may include construction underway at a particular intersection during that particular year or month, inhibiting pedestrian flow through that block.
During pedestrian counts, a contracted team member of Downtown Portland Clean & Safe stands at each intersection and uses directional counting boards to track the number of people entering from each direction for a 12-hour period. The information is compared to previous counts within the district and individually by intersection (if available) to gauge how activity has changed over time.
The intersections tracked this year include the following:
- NW 1st & Davis
- SW 2nd & Taylor
- SW 3rd & Clay
- SW 3rd & Morrison
- SW 4th & Yamhill
- NW 5th & Couch
- SW 5th & Morrison
- SW 6th & Alder
- SW 10th & Washington
- SW 10th & Morrison
- SW 10th & Burnside
- Broadway & Morrison
- Broadway & Yamhill
- Park & Alder
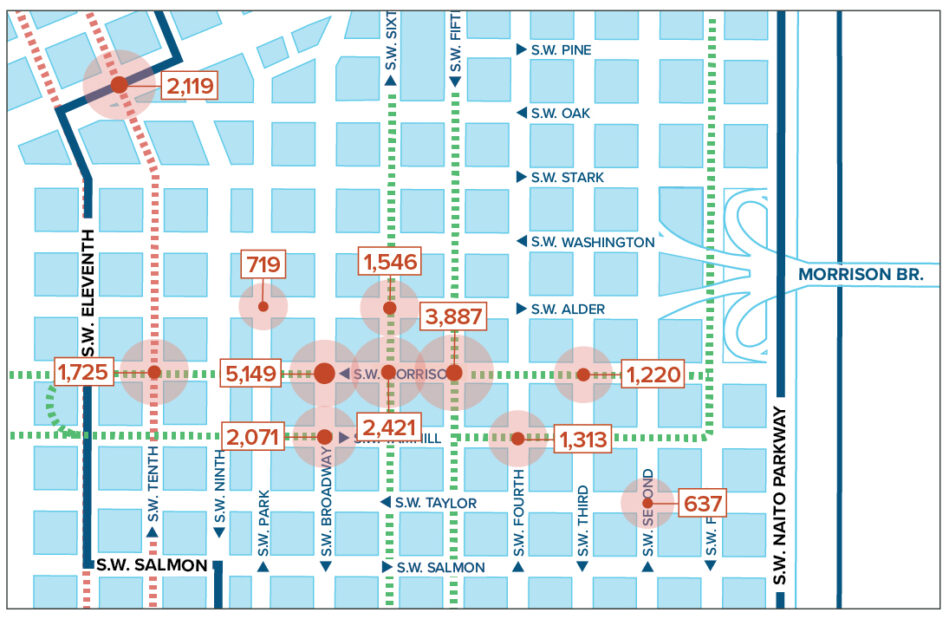
(click on image to download complete map)
Since 2005, on average, during the second weekend in December, a typical corner in Downtown Portland would include 11,621 pedestrians.
In December 2020 the average corner had only 1,738 pedestrians.
CONCLUSION/SUMMARY
Due to the coronavirus pandemic and Oregon public health restrictions in place in December 2020, we fully expected pedestrian counts to be lower than average for Downtown Portland.
However, the latest count demonstrates how much lower visitors on average are walking through our city’s center during peak hours of the holiday shopping season.
For more information about our pedestrian count or other programs, please contact us.