
Downtown Portland Clean & Safe monitors and publishes monthly foot traffic reports for the Clean & Safe District, offering a deeper look twice a year into downtown trends. These detailed reports highlight key intersections and uncover emerging patterns shaping the future of downtown.
Six Months of Growth: A Downtown Milestone
The first half of 2025 shows stronger and more sustained momentum than 2024. For the first time in recent years, we’ve recorded six consecutive months of year-over-year growth (March–August). January led with a 22% increase over 2024, boosted by strong winter activations, followed by steady gains through the spring and summer.
Key Highlights (January–August 2025)
- Six consecutive months of growth over 2024 (March–August), a milestone we did not see at all last year.
- January posted the largest gain (+22%), thanks to mild weather compared to 2024’s ice and snow.
- Saturdays remain the busiest day downtown, consistently outpacing other days of the week, with weekend activity driving retail and dining traffic. (Foot traffic on Saturdays is up 6.63% from 2024).
- Total foot traffic January–August 2025: 21.45 million (↑ 5.6% vs. 2024 for the same period).
Saturdays Still Rule Downtown
Saturdays continue to dominate as the busiest day in the Downtown Portland Clean & Safe District, closely followed by Fridays. Thursdays and Wednesdays also remain strong. This pattern shows the growing draw of weekend visitors alongside steady mid-week worker presence.
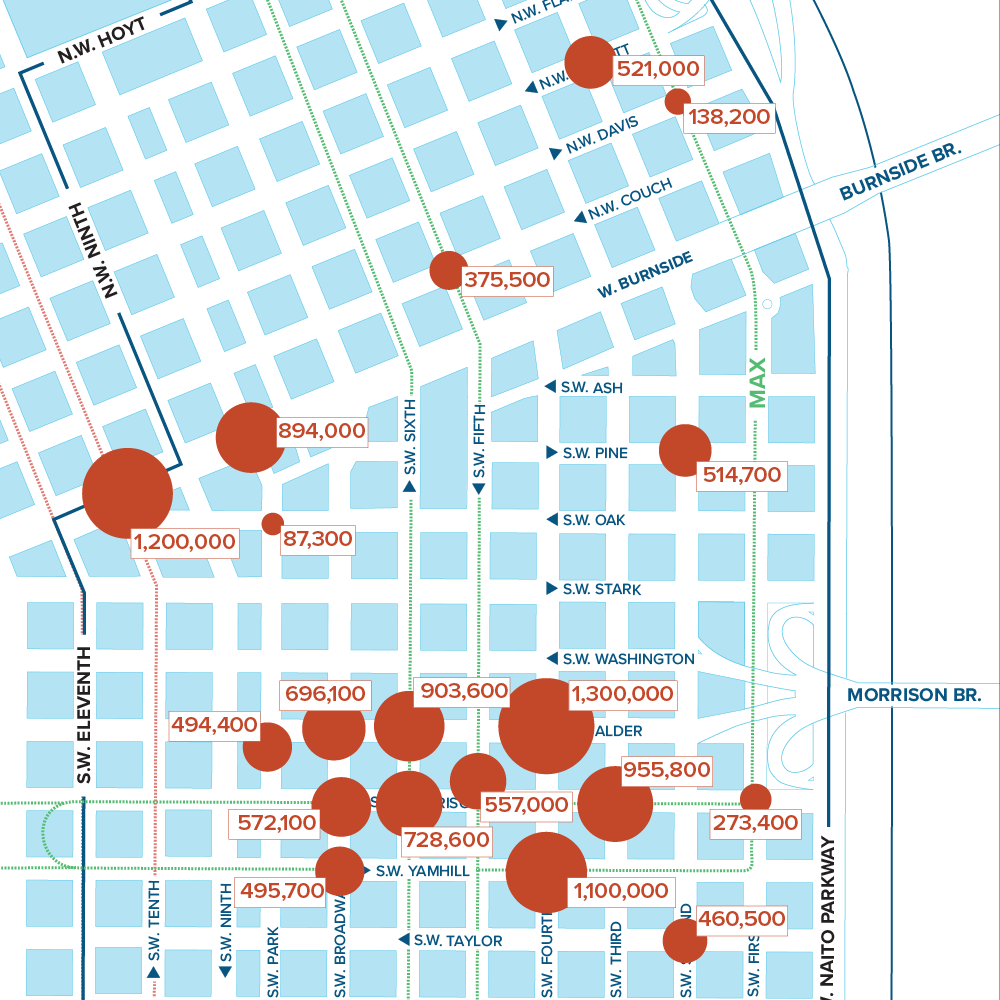
Where People Gather: Our Busiest Corners
Downtown Portland Clean & Safe tracks pedestrian volumes at key intersections across our 213-block district. It’s important to note: these counts measure the number of times people pass a corner, not unique visitors. A single person walking through the same corner multiple times will be counted each time.
Busiest Intersections (June 2025)
The data shows that Downtown’s core retail, cultural, and entertainment corridors remain the busiest — and many intersections are seeing strong year-over-year volumes.
- SW 10th & Burnside (Powell’s Books / Pearl District / West End gateway)
June 2025: 1.2 M crossings (steady compared to 2024) - SW Park & Burnside (Cart Blocks food pod & North Park Blocks gateway)
June 2025: 805 K crossings (down from 864K June 2024 but consistent with long-term averages) - SW 4th & Yamhill (Pioneer Place retail hub)
June 2025: 1.1 M crossings (30% increase over last year)
Old Town’s Growing Energy
Intersections Showing Notable Growth or Stability
- 5th & Couch (Old Town Entertainment District)
June 2025: 383 K crossings (+39% vs June 2024, signaling improved activity)
Key Takeaways
- High-traffic intersections are holding steady or growing, even compared to 2024’s period.
- Cultural and retail anchors continue to drive volume — Powell’s Books, Cart Blocks, Nordstrom, and Pioneer Place remain strong magnets.
- Old Town gateways are strengthening, with intersections like 5th & Couch showing sharp percentage gains.
Events Fuel Downtown Portland
Events continue to play an important role in drawing people into the Downtown and Old Town areas, adding to the steady momentum we’ve seen this year. Large legacy events such as Cinco de Mayo, Rose Festival, Blues Festival, and Pride coincided with notable increases in activity across the downtown core, reinforcing their impact as cultural anchors. Similarly, the PDX Live concerts at Pioneer Courthouse Square helped boost evening and weekend vibrancy. July and August weekends, in particular, stood out — featuring both PDX Live and festivals on the waterfront. Two newer events Rockstar Energy Open, and Project Pabst, ranking among the busiest periods of the summer. While these events are not the sole drivers of growth, they highlight how Downtown’s cultural calendar strengthens the district’s overall energy and foot traffic.
Visitors vs. Workers
Portland’s downtown foot traffic data tells a nuanced story in 2025—strong in visitor activity, but lagging in worker return. Through August 2025, foot traffic in the Downtown Portland Clean & Safe District has averaged roughly 70% of 2019 visitor volumes, with five consecutive months of year-over-year growth driven by events, weekend vibrancy, and tourism.
However, employee visits remain around 50% of 2019 levels, which is well below the national average of ~73% and trails peer cities such as Seattle (~66%) and Denver (~58%). While Portland’s visitor activity continues to rival other West Coast markets, its office recovery remains among the lowest of major U.S. cities, only ahead of San Francisco and Los Angeles.
Looking Forward
Downtown Portland’s foot traffic story in 2025 is one of resilience and renewed momentum. Six straight months of year-over-year growth signal that events, cultural anchors, and weekend vibrancy are successfully drawing people into the core. At the same time, the gap in office worker return remains a critical challenge, keeping weekday activity below that of peer cities. As we move into the second half of the year, the data underscores both the strength of Portland’s visitor economy and the continued need for strategies that support worker re-engagement.
Methodology
Using Placer.ai data to monitor traffic and visit trends 24-hours a day, Clean & Safe has expanded its pedestrian count research to look at the entire 213-block district. Downtown Portland Clean & Safe can now compare results from past years and even compare data to other cities, as well as look at times of day people are in downtown, which days are busier, and the spaces/venues people are frequenting.
We closely track pedestrian activity within our 213-block district. Our data provides insights into foot traffic trends, comparing year-over-year numbers. We monitor the overall number of people downtown, peak times of day, the busiest days of the week, and the spaces people are visiting most frequently. These figures represent cumulative totals rather than unique visitors, giving a comprehensive view of downtown vibrancy.
Our foot traffic counts are sourced from Placer.ai. In April 2024, Placer updated its methodology to improve accuracy. This update slightly changes past figures compared to what we reported earlier. Moving forward, we’ll use the updated numbers for year-over-year comparisons to ensure consistency.