Twice each year, Downtown Portland Clean & Safe engages with partners to conduct pedestrian counts in Downtown Portland over a three-day period. These teams count pedestrian traffic at key intersections during peak hours within the Downtown Portland Clean & Safe District, a 213-block enhanced services district in the heart of our city.
Pedestrian counts are used to monitor changes in walking patterns during the summer and winter months, year after year, and to better understand the flow of pedestrians through our city’s center.
The results of our latest pedestrian count conducted over three days, December 9, 10, and 11, 2021, are below.
BLOCK BY BLOCK COMPARISON
For the past 15 years, the pedestrian counts are carefully conducted during the months of June and December and recorded by the teams at Downtown Portland Clean & Safe (read past reports here). The locations of each intersection included in the count change year to year for several reasons, some of which may include construction underway at a particular intersection during that particular year or month, inhibiting pedestrian flow through that block.
During pedestrian counts, a contracted team member of Downtown Portland Clean & Safe stands at each intersection and uses directional counting boards to track the number of people entering from each direction for a 12-hour period. The information is compared to previous counts within the district and individually by intersection (if available) to gauge how activity has changed over time.
The intersections tracked this year include the following:
- SW 3rd & Morrison
- SW 4th & Yamhill
- NW 5th & Couch
- SW 6th & Alder
- SW 6th & Morrison
- SW 10th & Morrison
- Broadway & Washington
- Broadway & Yamhill
- Park & Alder
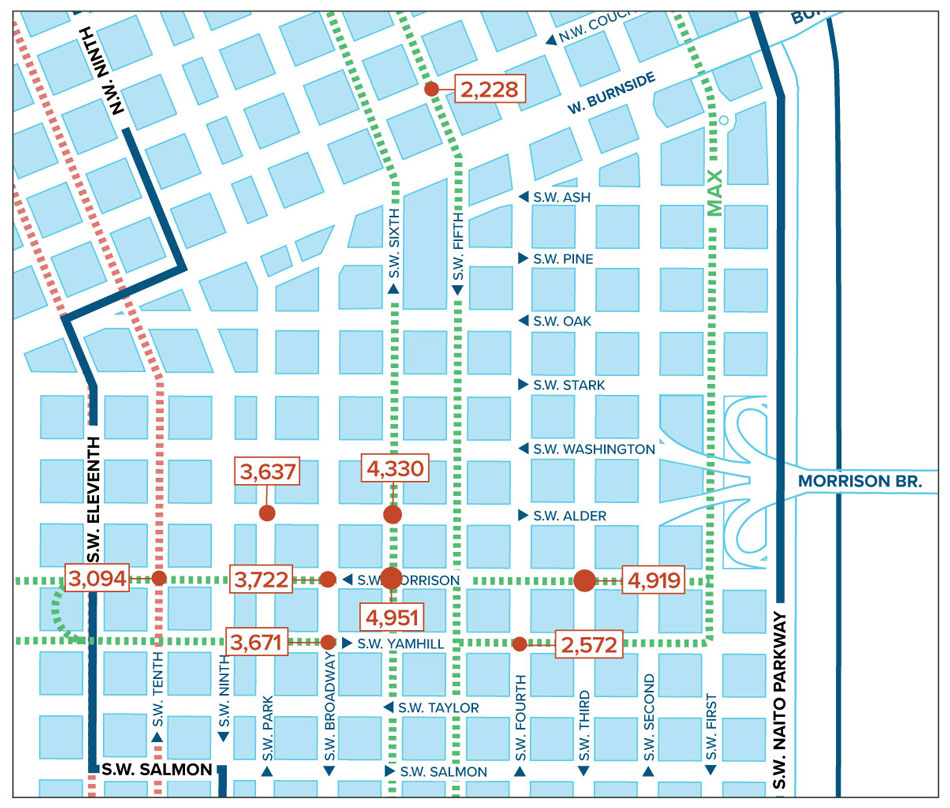
(click on image to download complete map)
Since 2015, on average, during the second weekend in June, a typical corner in Downtown Portland would include 9,550 pedestrians.
In December 2021, the average corner had 3,680 pedestrians, far below previous averages and only a slight increase from the June 2021 average.
CONCLUSION/SUMMARY
The marginal increase in pedestrian traffic Downtown reveals that we still have a long way to go before we can realize a full recovery.
While many Downtown retail locations and other businesses have re-opened and are learning to live within the shadow of the COVID-19 pandemic, many office workers who traditionally help make Downtown Portland a vibrant economic center have not yet returned to their Downtown offices. This, along with livability issues, safety issues, and the city’s reputational damage have resulted in the City of Portland lagging behind other cities in its recovery efforts.
For more information about our pedestrian count or other programs, please contact us.