Twice each year, our teams count pedestrian traffic at key intersections during peak hours within the Downtown Portland Clean & Safe District, a 213-block enhanced services district in the heart of our city.
These counts are used to monitor change in walking patterns during the summer and winter months, year over year and better understand the flow of pedestrians through our city’s center.
The results of our latest pedestrian count conducted over three days, June 10, 11, and 12, 2021, are below.
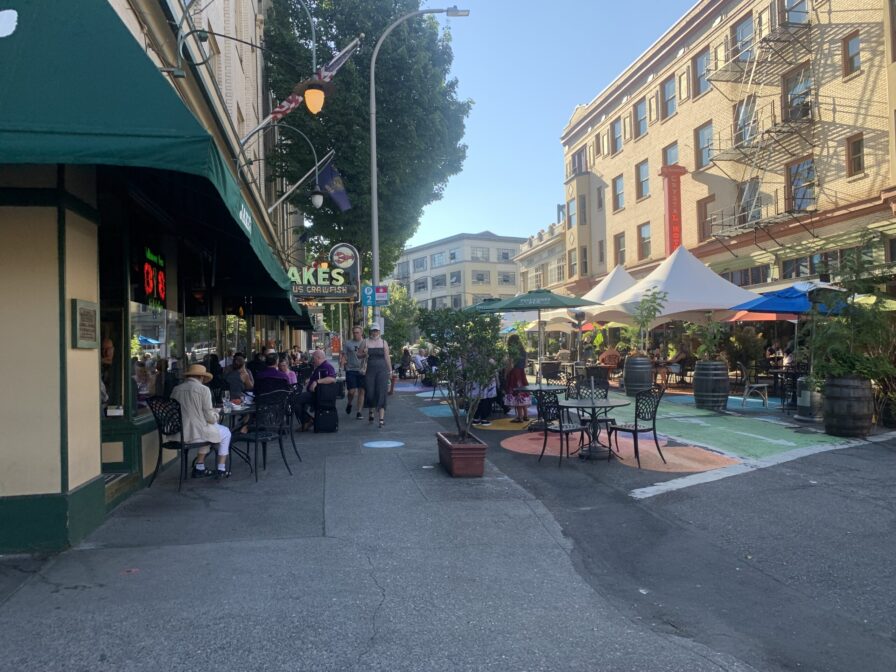
While many offices and places of business in Downtown have remained closed because of the continued coronavirus pandemic and its side effects, we are seeing a cautious recovery in the Downtown core with the easing of restrictions on restaurants and retailers and some outdoor events returning. As a result, there was a 52% increase in pedestrian traffic compared with the counts last December.
BLOCK BY BLOCK COMPARISON
For the past 15 years, the pedestrian counts are carefully conducted during the months of June and December and recorded by the teams at Downtown Portland Clean & Safe (read past reports here). The locations of each intersection included in the count change year to year for several reasons, some of which may include construction underway at a particular intersection during that particular year or month, inhibiting pedestrian flow through that block.
During pedestrian counts, a contracted team member of Downtown Portland Clean & Safe stands at each intersection and uses directional counting boards to track the number of people entering from each direction for a 12-hour period. The information is compared to previous counts within the district and individually by intersection (if available) to gauge how activity has changed over time.
The intersections tracked this year include the following:
- NW 1st & Davis
- SW 2nd & Taylor
- SW 3rd & Morrison
- SW 4th & Yamhill
- NW 5th & Couch
- SW 6th & Alder
- SW 6th & Morrison
- SW 10th & Morrison
- SW 10th & Burnside
- Broadway & Yamhill
- Park & Alder
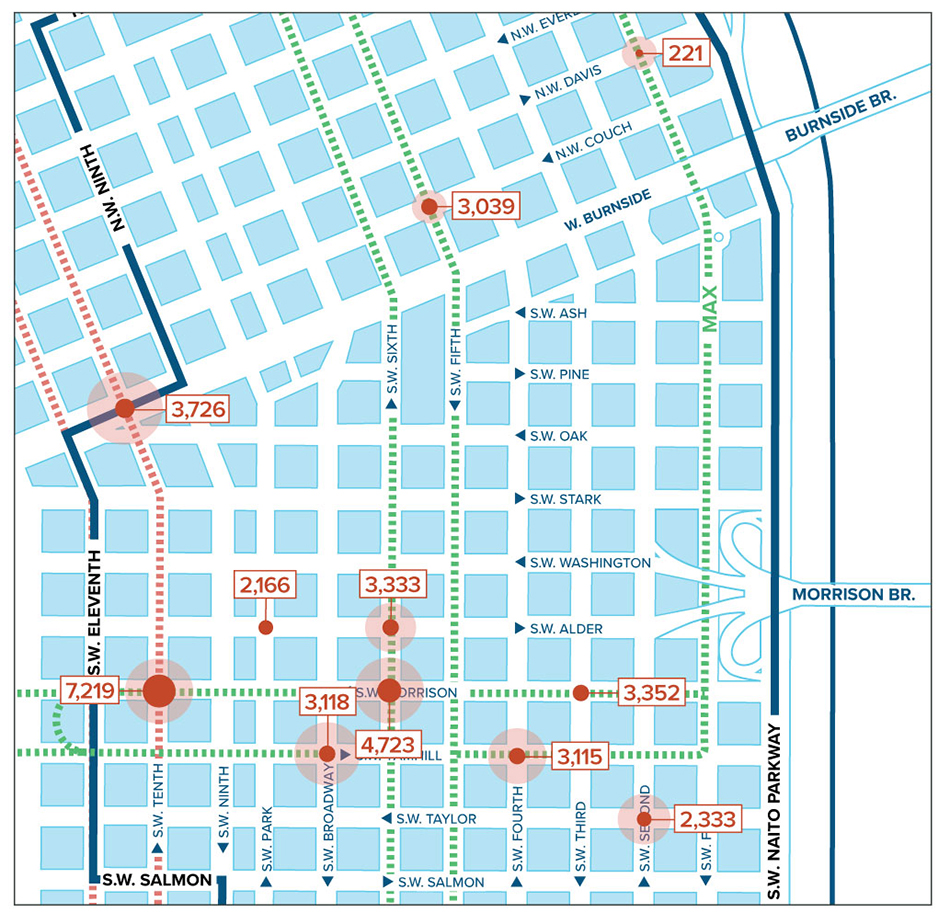
(click on image to download complete map)
Since 2015, on average, during the second weekend in June, a typical corner in Downtown Portland would include 9,550 pedestrians.
In June 2021 the average corner had 3,304 pedestrians, an increase from December 2020 from 1,738 pedestrians.
CONCLUSION/SUMMARY
The increase in pedestrians Downtown shows that we are on the road to recovery.
While many offices and places of business in Downtown have remained closed because of the continued coronavirus pandemic and its side effects, we are seeing a cautious recovery in the Downtown core with the easing of restrictions on restaurants and retailers and some outdoor events returning.
For more information about our pedestrian count or other programs, please contact us.