Twice a year, Downtown Portland Clean & Safe takes a deeper dive and looks at foot traffic and the number of visits for the whole district as well as individual intersections in the downtown area using Placer.ai. The current trend shows consistent progress, with a 3% increase in foot traffic in 2024 compared to 2023, an 8% increase in employee foot traffic, and a remarkable 54% increase from downtown Portland’s low foot traffic point in 2021. This growth is an encouraging sign of downtown’s appeal and ongoing resilience as more people return to the heart of our city.
See Figure 1.
Downtown Portland Clean & Safe engages with Placer.ai to monitor pedestrian traffic in its 213-block area district. We monitor the number of people in the downtown area, the times of day people are in coming downtown, which days of the week are busier, and the spaces they are frequenting. These are not unique visitors, but cumulative totals.
Here are the trends within the Downtown Portland Clean & Safe district for 2024.
Events Bring People Downtown
February saw a festive surge in the downtown core, with foot traffic increasing by 10% compared to 2023 levels. This rise was primarily due to the Portland Winter Light Festival, Biamp Portland Jazz Festival, and mild weather. Similarly, June experienced a boost in foot traffic, with an increase of 4% compared to 2023, largely attributed to activities related to the Portland Rose Festival and unseasonably warm, dry weather.
During the summer, we observed notable increases in foot traffic throughout the downtown area, driven by large-scale festivals and events, including the Rockstar Energy Open (August 23 – 25) and the Foo Fighters concert on August 16, which drew 30,000 attendees to Providence Park. During summer weekends (June 1 – October 31), foot traffic increased by 6%. During Coraline’s Curious Cat Trail (August 1 – October 13), Saturday foot traffic rose by 11% compared to 2023, while Sunday foot traffic saw an increase of 14%.
See Figure 2.
Downtown is Popular For Weekend Visitors
The Downtown Portland Clean & Safe district continues to see overall traffic busiest on Friday & Saturday. Event venues drive an increase in foot traffic. Keller Auditorium saw a 3% rise compared to 2023, while the Arlene Schnitzer Concert Hall reported a 4% increase. Additionally, the Old Town Entertainment District and the area within 250 feet of the Dixie Tavern witnessed a significant surge in visits, with a remarkable increase of 28% over 2023.
We observed an 8% rise in employee foot traffic compared to the previous year. Tuesdays, Wednesdays, and Thursdays continue to be the most favored days for our employees to be in the district. These weekly patterns have remained stable since 2023.
See Figure 3.
Foot Traffic Hotspots
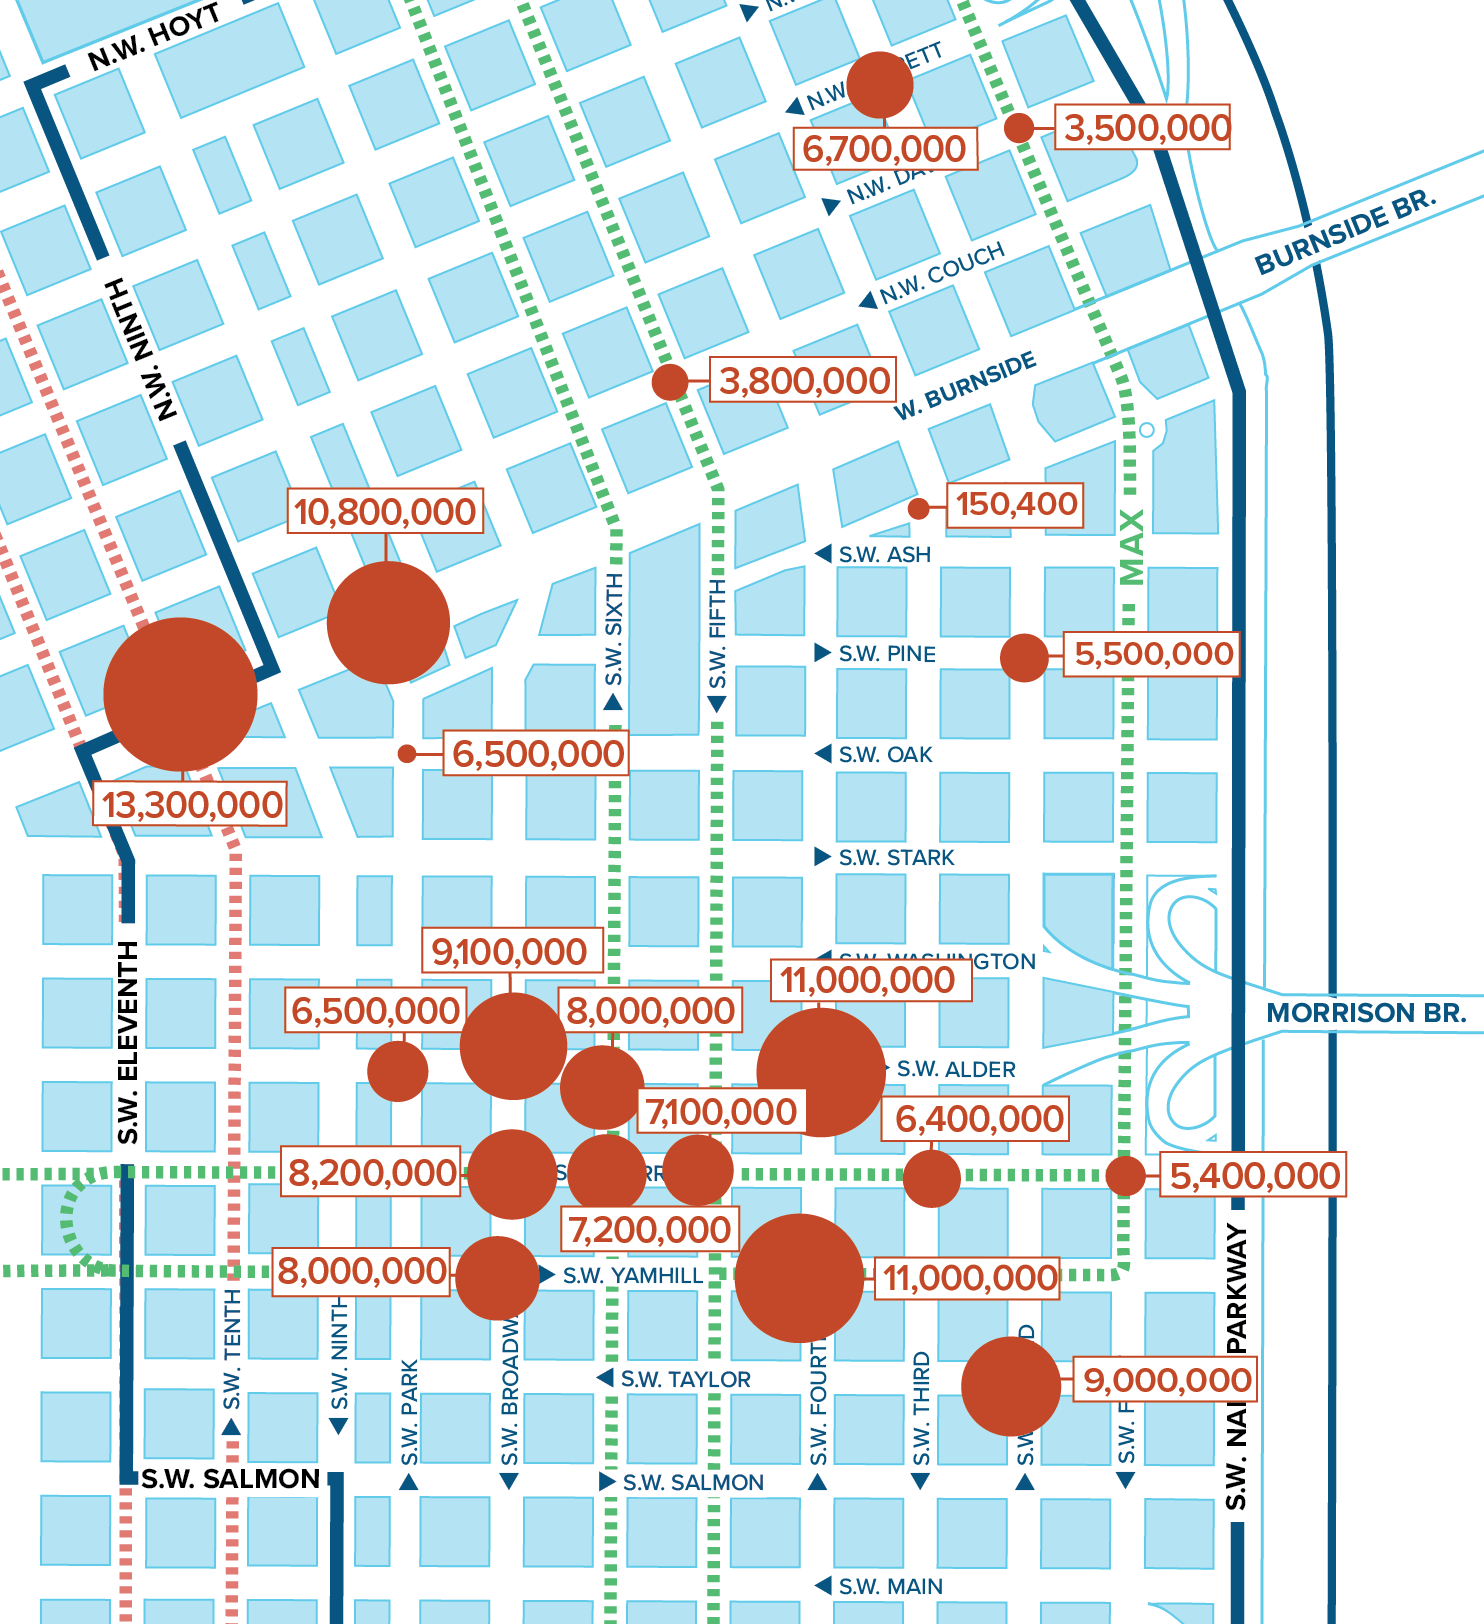
When we look at the busiest locations in our district, we see that the West End Neighborhood continues to be a hotspot of foot traffic along with intersections in the core of downtown. The intersection at SW 10th & Burnside, across the street from Powell’s Books, is the busiest intersection in our district.
(click on image to download full map)
Director Park has transformed into a vibrant destination, thanks to a public-private partnership with Downtown Portland Clean & Safe, to provide enhanced services and program activations in addition to the municipal services provided by the Parks Bureau. Foot traffic has increased significantly, showing a 30% rise compared to 2023. This year serves as an important benchmark for measuring future success, highlighted by 312 unique events, including Mike Bennett’s Snow Day Village in November and December.
See Figure 4.
Methodology
Downtown Portland Clean & Safe uses Placer.ai to monitor foot traffic and visit trends 24-hours a day and looks at the 213-block geographic boundary of the Clean & Safe. Placer.ai data allows us to look at times of day people are downtown, which days are busier, and the spaces/venues people are frequenting. Individuals are counted each time they cross into our district or, when looking at particular intersections, each time they cross that intersection.
Placer.ai uses an algorithm to separate visitor counts, employee counts, and resident counts, which essentially examines patterns in length of stay. For example, users who spend approximately 8 hours a day in a specific location regularly are counted as employees. Users who spend their nights in one location regularly are counted as residents.

